local_gradeheatmap

Colour-codes the cells of the Moodle grader report by grade percentage, so teachers can see where students struggle and excel.
verified and archived by the registry · newer than the source platform's last reported tagDownload and compatibility
verification ledger
Source tagged by maintainer
github.com/adamjenkins/moodle-local_gradeheatmap @ v0.1.4 · commit ba7a60fa1f12
Rebuilt deterministically from that tag
canonical ZIP, byte-identical on every rebuild
Artifact hash recorded in the public index
sha256 8b5efe99064f140df825dffd238d6c25f424d9d1a33dbe91d40c3b907be2cc9d
Release signed · trusted publishing
planned — TUF signing (RFC §4.3)
Recorded in public transparency log
planned — Sigstore/Rekor (RFC §4.3)
composer require adamjenkins/moodle-local_gradeheatmap
All versions
About
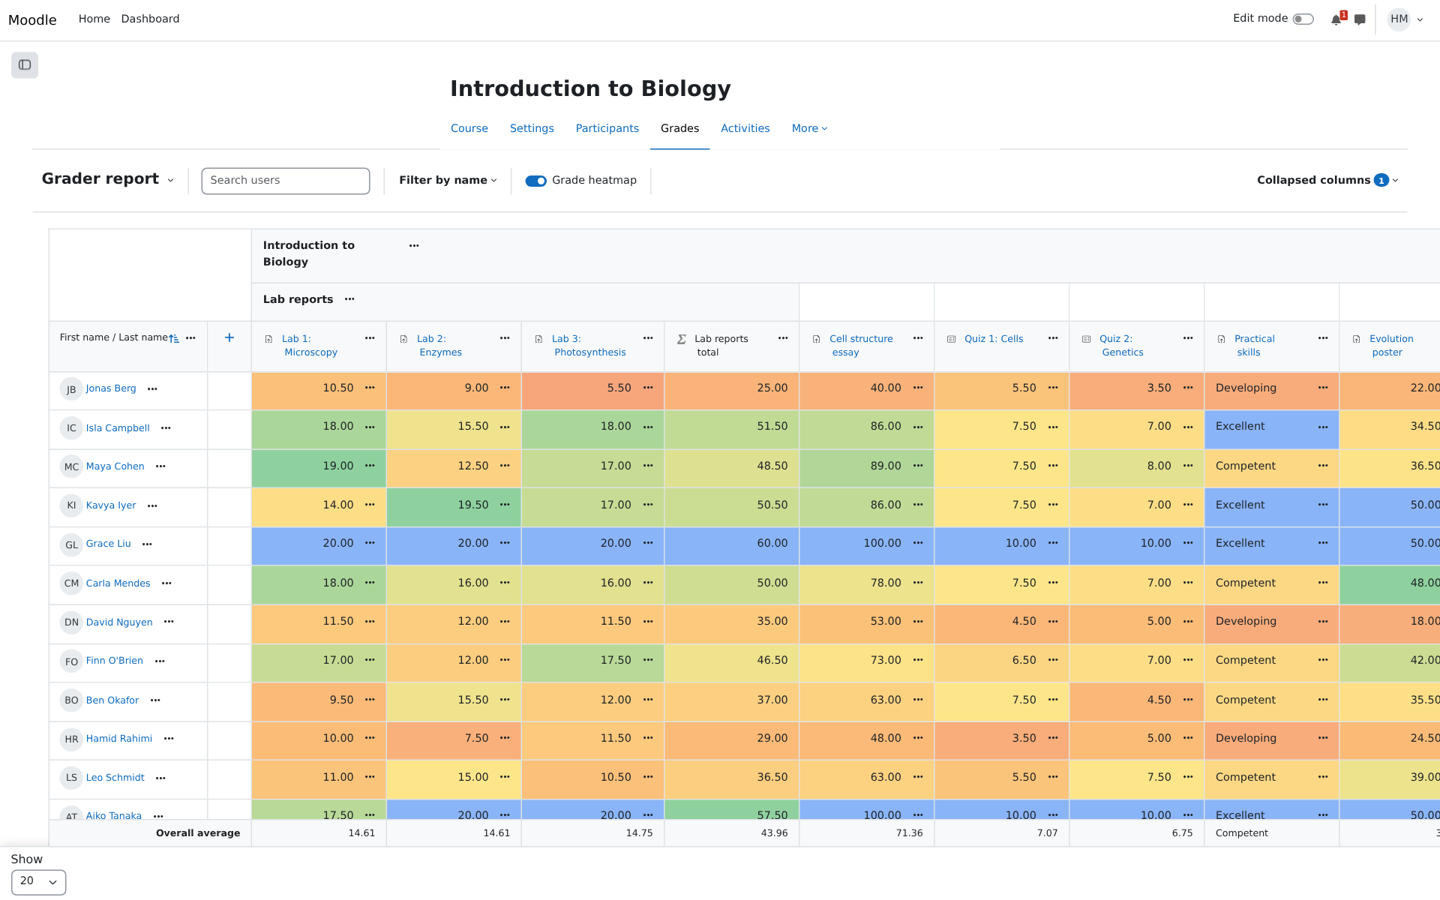
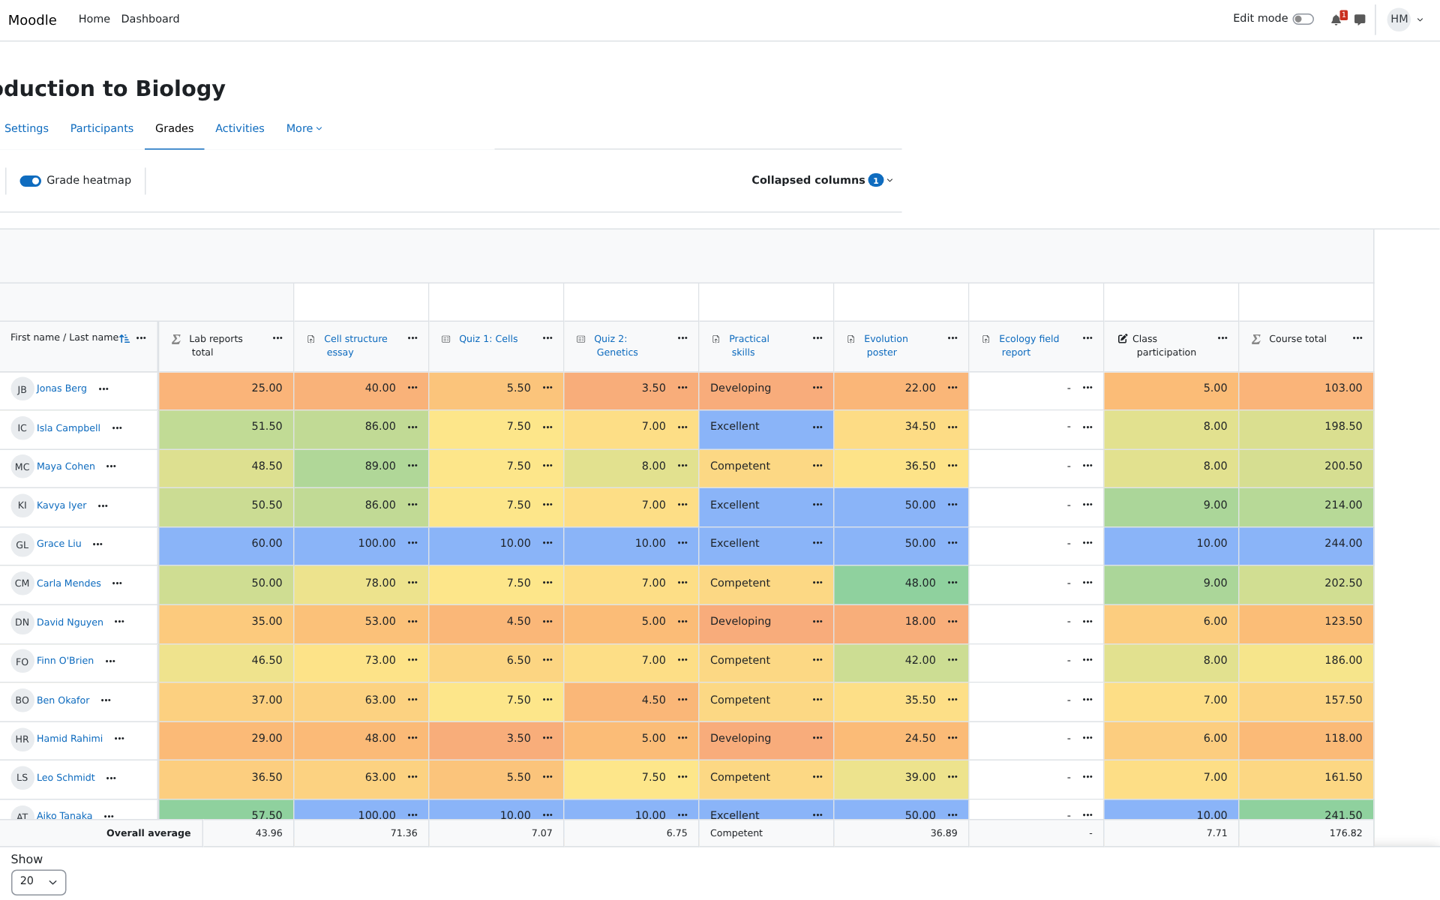
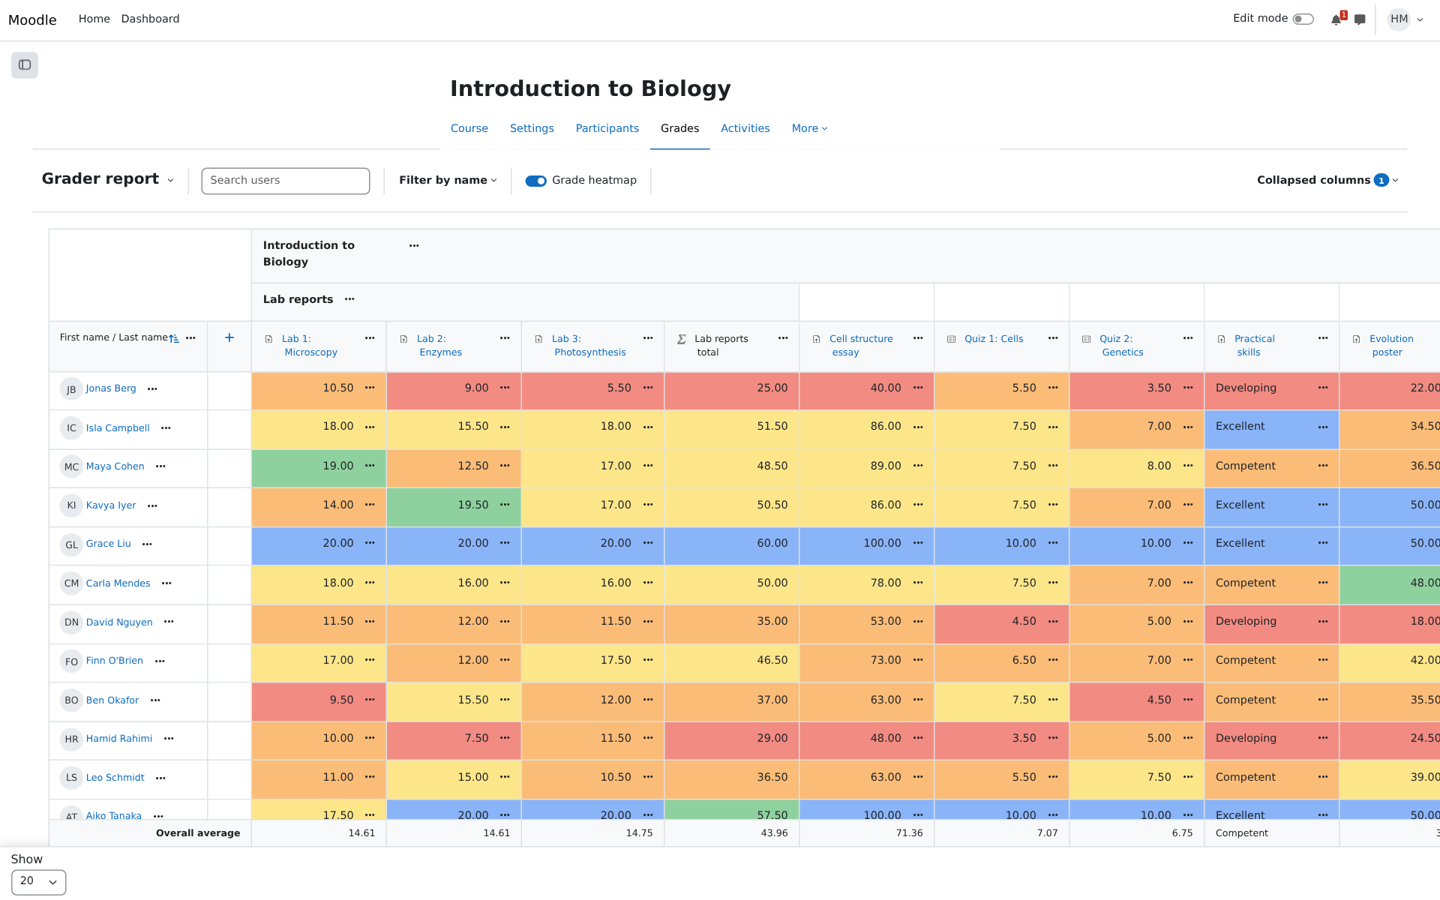
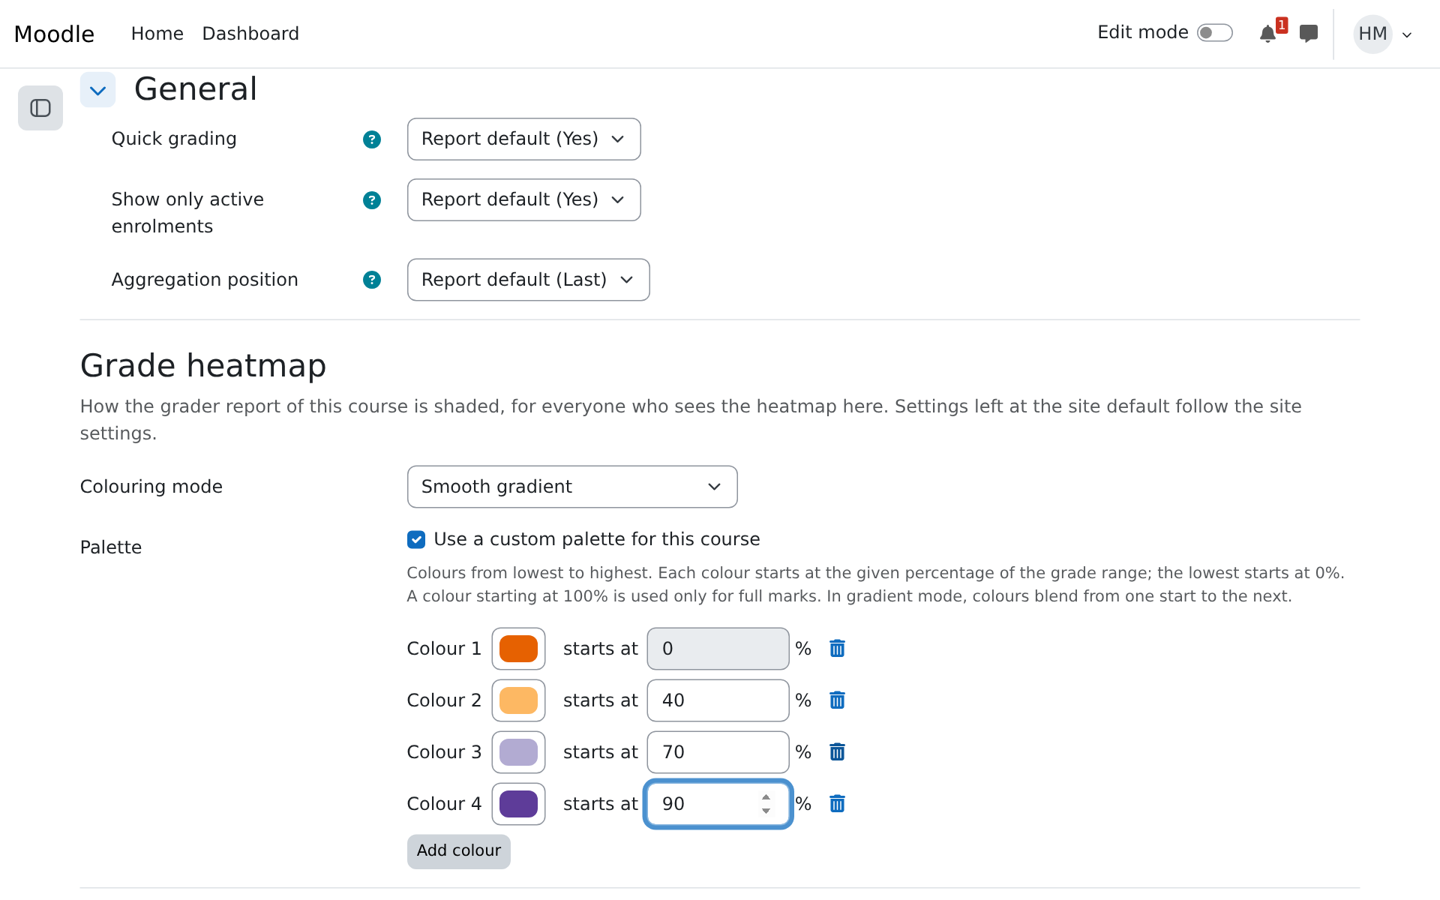
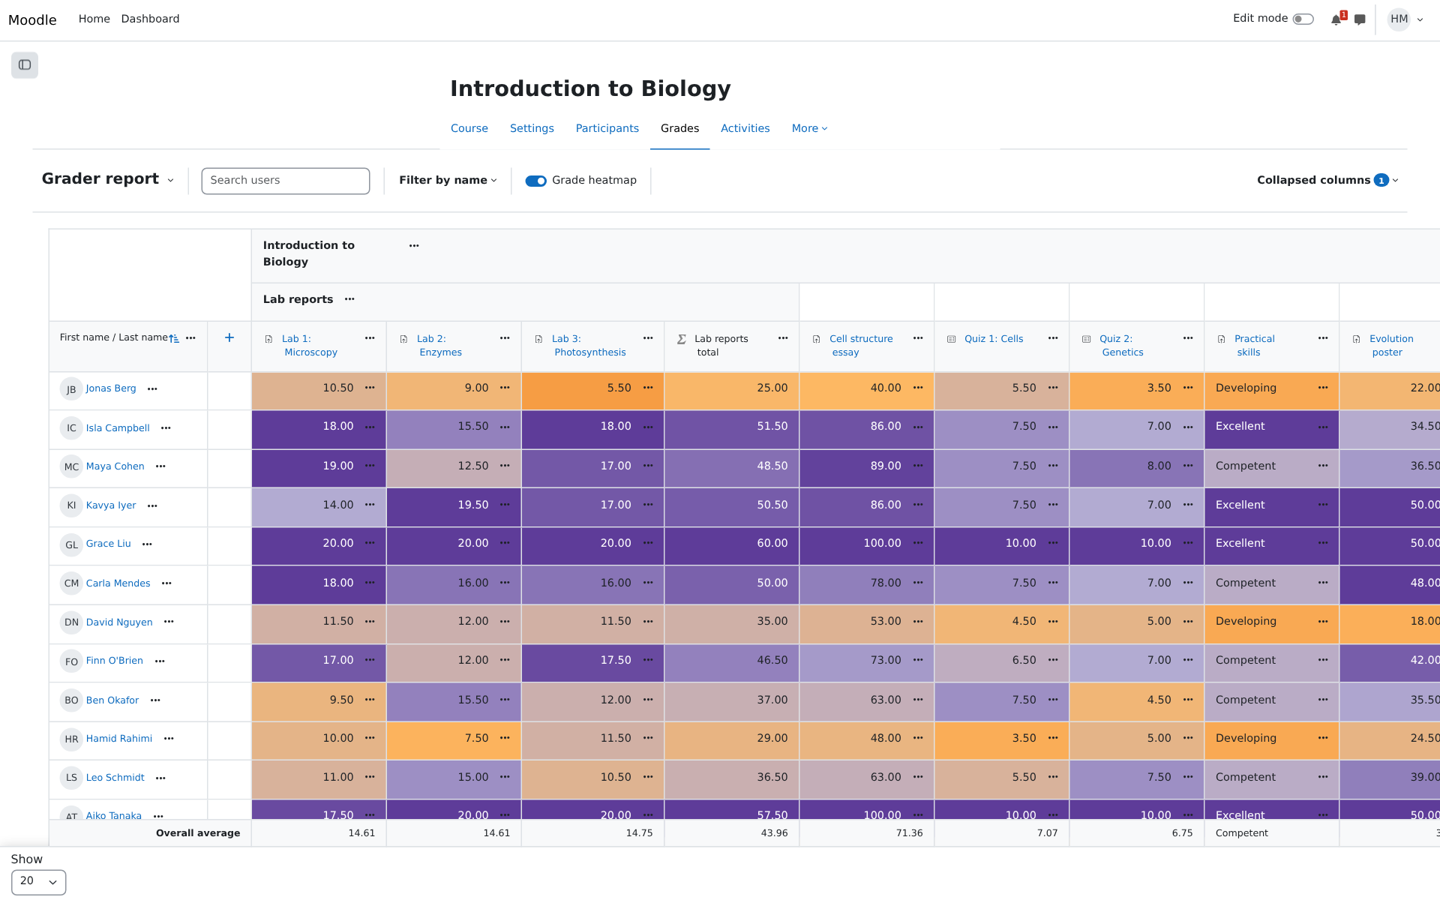
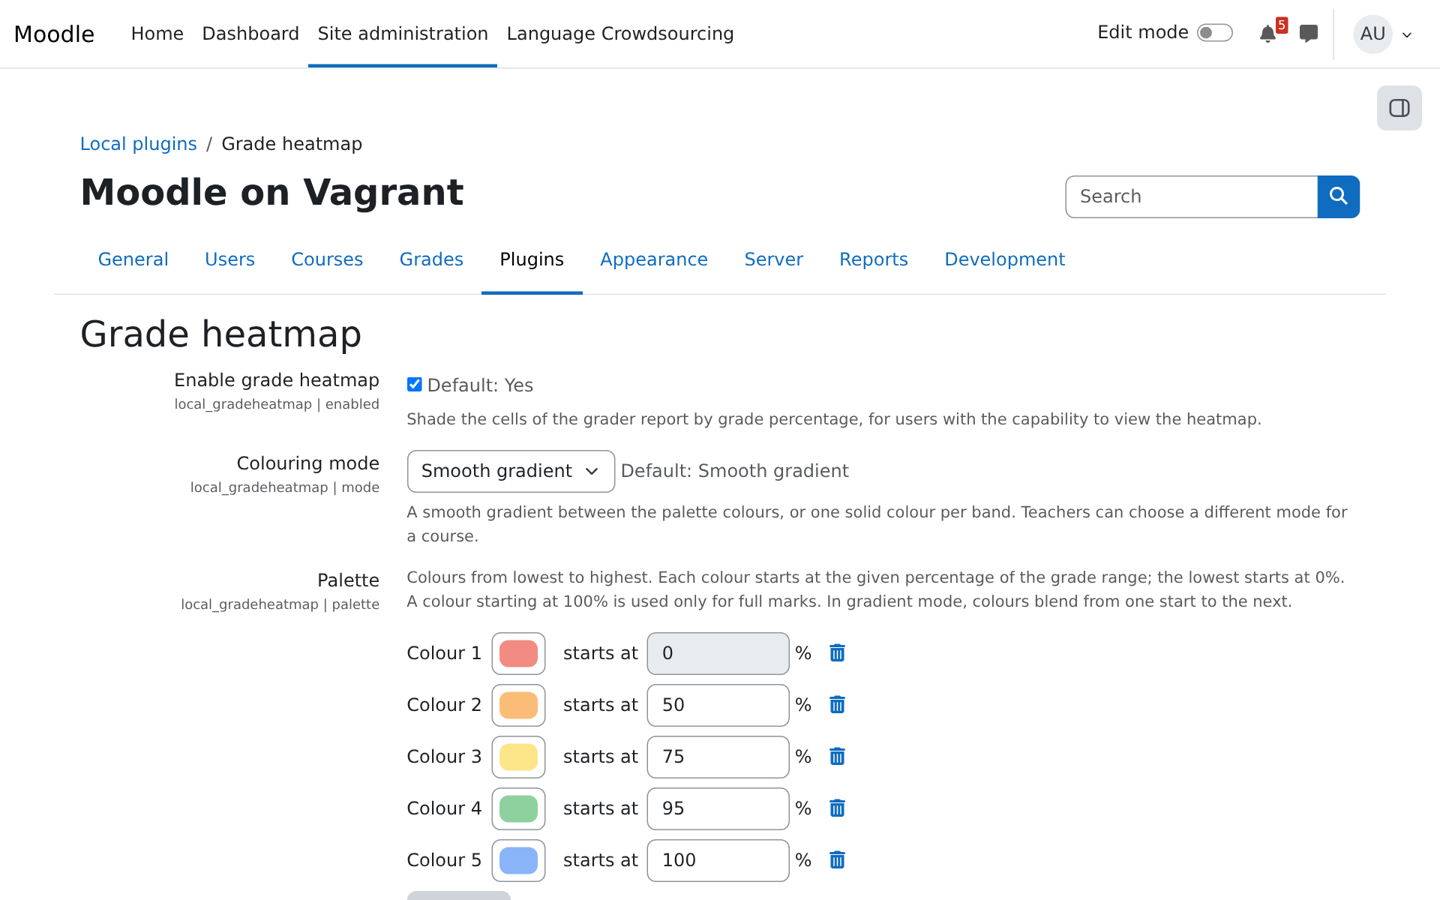
For teachers using the gradebook grader report. Each grade, category total and course total cell is shaded by its percentage of the item's range, from red through orange and yellow to green, with blue reserved for full marks. Grade values are never changed. Admins set a site-wide gradient or banded palette, teachers can override it per course, and each user can switch the shading on or off from the report's action bar.